Colored Area
Draws color-coded areas in any indicator panel — instantly see when ATR, Volume, ADX, or MACD cross key thresholds.
Download Free
How it works
This indicator draws a colored area within a chosen panel, highlighting a defined range based on the upper and lower values you set. As market data fluctuates, the indicator visually emphasizes when key levels — such as overbought or oversold thresholds — are reached or crossed, allowing you to quickly identify potential trend reversals and significant price actions.
What can I use it for?
ATR-Based Volatility Zone
Use the indicator on an ATR panel to highlight periods of changing volatility. Setting upper and lower thresholds to multiples of ATR lets you quickly see when the market becomes more volatile — helping adjust stop-loss distances and position sizes.
Volume Threshold Highlighting
Apply to a volume panel to define a normal range for trading activity. A colored area marking typical volume levels alerts you when volume spikes or drops significantly, indicating potential trend reversals or breakout opportunities.
MACD Signal Range
Use on a MACD panel to mark a specific range around the signal line. This visual zone helps you quickly identify when the MACD is approaching key levels — making it easier to spot momentum shifts or trend reversals.
ADX Range Visualization
Display ADX with a highlighted range to easily identify shifts in trend strength. When ADX values move out of the preset range, it provides a visual cue that the current trend may be gaining or losing momentum.
Settings
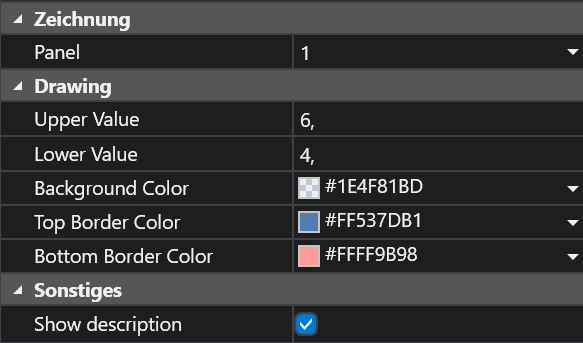
Panel
The specific chart panel where the colored area will be displayed. Select any indicator panel (ATR, Volume, ADX, etc.).
Upper Value
The top boundary of the highlighted area — e.g., 80 for overbought conditions.
Lower Value
The bottom boundary of the highlighted area — e.g., 20 for oversold conditions.
Background Color
The fill color for the area between the upper and lower values.
Top Border Color
Color of the line marking the upper edge of the highlighted area.
Bottom Border Color
Color of the line marking the lower edge of the highlighted area.
Frequently Asked Questions
Can I adjust the indicator for different technical analysis tools?
Yes, you can customize the panel and value settings to work with various indicators like ATR, Volume, or any other indicator available in ATAS.
How do I ensure the colors are clearly visible on my chart?
Choose contrasting colors for the background, top border, and bottom border that stand out against your chart's theme. Experiment with different shades if necessary.
Get Colored Area
Subscribe to download all indicators for free — including future updates.