How to Use the Visible High Low Indicator in ATAS
Learn how the Visible High Low indicator helps you identify key price levels in your ATAS chart — and how to use it for support/resistance, stop-loss placement, and breakout confirmation.
If you’ve ever scrolled through a chart in ATAS and wished you could instantly see the highest and lowest price in your current view — that’s exactly what the Visible High Low indicator does. It’s one of the six free indicators we built at Empathy Edge Markets to solve real problems we kept running into during our own trading sessions.
It sounds simple. It is simple. But simple tools used well are what separates consistent traders from the rest.
What does it do?
The indicator marks two things on your chart:
- The highest price currently visible on screen
- The lowest price currently visible on screen
As you scroll or zoom, the lines update in real-time. No lag, no manual drawing — just clean, automatic levels.

Why does this matter?
Most traders already look at highs and lows. The difference is that this Empathy Edge Markets indicator does it for you, automatically, which means:
- You never miss a key level because you were focused on something else
- The levels are always relevant to what you’re actually looking at (not some arbitrary timeframe)
- You free up mental bandwidth for actual trading decisions
4 ways to use it in your trading
1. Quick support and resistance
The visible high and low are natural support and resistance levels. Price already proved it respects these points — that’s why they’re the high and low. Use them as reference points for entries and exits.
2. Stop-loss placement
Placing a stop beyond the visible high (for shorts) or below the visible low (for longs) gives you a logical stop-loss level based on actual recent price action — not an arbitrary number.
3. Breakout confirmation
When price breaks above the visible high or below the visible low, it’s a signal that the current range is expanding. This can confirm breakout entries or warn you that a range trade is failing.
4. Trend identification
If the visible high keeps moving up while the visible low also rises — you’re in an uptrend. If both are declining — downtrend. It’s a quick visual check without adding more indicators to your chart.
Settings
The indicator keeps it minimal:
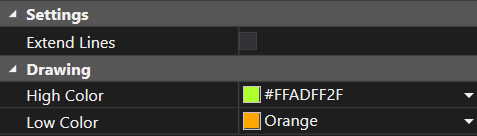
- Extend Lines — whether the lines extend across the full chart or just mark the level
- High Color / Low Color — customize to match your chart theme
How to install
- Download the Empathy Edge Markets indicator pack (free, all six indicators included)
- Copy the file into your ATAS indicators folder
- Add it to your chart via the indicator menu
- Done — the levels appear automatically
Final thoughts
The best trading tools are the ones you don’t have to think about. The Visible High Low indicator sits quietly on your chart and gives you exactly the information you need, when you need it.
It won’t predict the future. But it will make sure you never miss what’s right in front of you.
It’s part of our philosophy at Empathy Edge Markets: build tools that remove friction from your trading, so you can focus on what actually matters — making better decisions.
Want more ATAS tips?
Subscribe to get indicator updates, trading insights, and new blog posts.